
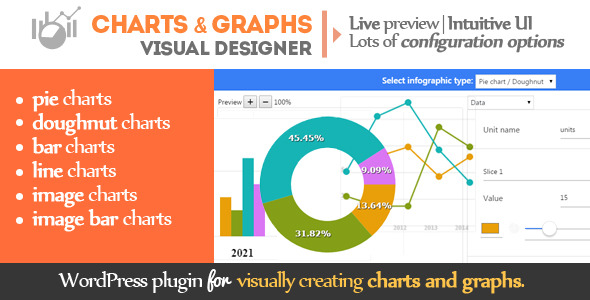
WordPress plugin for visually creating charts and graphs.
This plugin allows you to easily add and integrate charts and graphs into your posts and pages. Very intuitive UI and lots of configuration options for creating
- stunning pie charts and doughnut charts
- bar charts (vertical, horizontal, stacked)
- line charts
- image charts
- image bar charts (with these 2 last charts you can use your own PNG images as shapes to create your charts).
Update 16.01.2019: fixed minor bugs related to display issues with the chart legend
Update 24.03.2016: starting with version 0.0.2 the plugin is compatible with modern WordPress themes including Avada WordPress theme
The Charts and Graphs Visual Designer is ideal for statistical graphs, poll results and infographics.
Check our some WordPress charts live samples.
Interactive charts
Charts visual designer integrated in the posts and pages editor
Live preview while editing the charts
Fully customizable color palette
Video Preview
Did you know that you can manually insert HTML bar charts in your WordPress posts and pages? However, using the WordPress Visual designer this is a lot easier to do.
Credits for the graphics:
- Images for the backgrounds: 90 subtle patterns
- Graphic design by PSD Dude