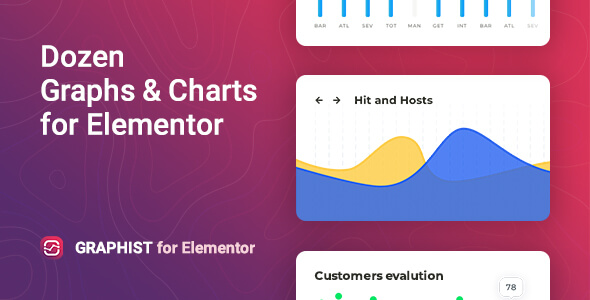
The Graphist is a charting WordPress plugin that activates a set of widgets for the Elementor Builder. The widgets allow you to create different kinds of graphs and charts for a bright and clear display of quantitative data on your websites.
The plugin was built on the popular Chartist.js library, which is known for its flexible settings, wide charting capabilities, and adaptability. The graphs creation can be useful for displaying various kinds of reports or statistics. Regardless of the amount and type of data, the Graphist set of widgets will help to visualize them in a form convenient for you.
When activating the charting plugin, you get 12 Elementor Builder widgets for creating such chart types: Line, Bar, Pie, Donut, Gauge, Dots, Bi-polar Line, Bi-polar Bar, Multiline Bar, Stacked Bar, Area, Holes.
The Graphist has very flexible settings. You can add the required amount of data, adjust the grid display and change the colors, fonts, paddings, and margins for elements. All this can be configured directly from the Elementor’s interface and does not require additional code knowledge.
Graphist for Elementor is exceptionally compatible with all modern browsers. It does not matter which browser users view your site: Chrome, Firefox, Opera, Safari, or Edge. Everything will look great on all devices and in all browsers.
Features of the Grahpist set of widgets for Elementor
- Perfect for Elementor 2.5 and higher
- 12 types of charts available
- Built on Chartist.js library
- Customizable colors, borders, margins, paddings, animation, etc.
- Automatically sets the optimal step for the graph scale
- Flexible grid settings
- Flexible style settings for chart convention
- Responsiveness settings
- Works well with all WordPress themes built on Elementor
- Totally Seo Friendly
- Included pot file for quick translation on any language
- Perfect for RTL direction
- Fast and smooth installing
- Tested and compatible up to WordPress 5+
- Lightweight and Fast
- All major browsers supported Chrome, Firefox, Safari, Opera, and Edge
- Easy to use and customize with modern User Interface
- Installation Guide and detailed Users Manual
- Six months Included Support for CodeCanyon buyers
The plugin installation takes only a few seconds. Also, you do not need to make any additional settings. The plugin is ready to work immediately after installation – you only need to install and activate it in WordPress. Read more about capabilities and settings in the Online Documentation.
Changelog
1.2.10 - 18 January 2025
Added styles for axis titles
Fixed a warning when axis titles are disabled
Changed the title for the controller
1.2.9 - 23 December 2024
Added axis title plugin for charts.
1.2.8 - 19 December 2024
Improved plugin compatibility with a latest version of Elementor
1.2.7 - 9 August 2024
Improved compatibility with PHP 8
1.2.6 - 2 August 2022
Area Chart - Added blending mode setting for areas
Area Chart - Added color for grid lines for horizontal and vertical lines
Area Chart - Added dash size grid lines
Line Chart - Added color for grid lines for horizontal and vertical lines
Line Chart - Added show/hide setting for points
1.2.5 - 24 March 2022
Removed deprecated _register_controls method
1.2.4 - 1 February 2022
Line Chart, Gauge Chart, Donut Chart: Improved initialisation in the popup
1.2.3 - 1 February 2022
Fixed adding new lines in Line Chart
1.2.2 - 27 January 2022
Resolved notices in Gauge chart
1.2.1 - 23 November 2021
Fixed notices for empty data values
More changes in the changelog